4QFY2017 Result Update | Pharmaceutical
June 5, 2017
Cadila Healthcare
NEUTRAL
CMP
`495
Performance Highlights
Target Price
-
4QFY2017
3QFY2017
% chg (qoq)
4QFY2016
% chg (yoy)
Investment Period
Y/E March (` cr)
Net sales
2,418
2250
7.5
2270
6.5
Stock Info
Other income
134
78
71.3
104
28.2
Sector
Pharmaceutical
Gross profit
1489
1350
10.3
1492
(0.2)
Market Cap (` cr)
50,629
Operating profit
403
343
17.6
486
(17.1)
Net debt (` cr)
3,616
Adj. Net profit
386
324
19.0
568
(32.1)
Beta
0.8
Source: Company, Angel Research
52 Week High / Low
505 / 305
Avg. Daily Volume
31,726
For 4QFY2017, Cadila Healthcare posted lower than expected results. The sales came in at
Face Value (`)
1
`2,418cr (v/s. `2,800cr expected) v/s. `2,270cr in 4QFY2016, a yoy growth of 6.5%. On
BSE Sensex
31,273
the operating front, the EBITDA margin came in at 16.7% v/s. 21.4% (v/s. 15.7% expected)
Nifty
9,654
in 4QFY2016. The GPM’s came in at 61.6% (v/s. 65.7% in 4QFY2016), which resulted in
Reuters Code
CADI.BO
the dip in OPM. This, along with the 49.9% yoy increase in deprecation lead the Adj. net
Bloomberg Code
CDH@IN
profit to register `386cr (v/s. `353cr expected) v/s. `568cr in 4QFY2016, a yoy de-growth
of 32.1%. We remain Neutral.
Shareholding Pattern (%)
Results lower than expected: The sales came in at `2,418cr (v/s. `2,800cr expected) v/s.
Promoters
74.8
`2,270cr in 4QFY2016, a yoy growth of 6.5%. The growth was mainly driven by the other
MF / Banks / Indian Fls
9.7
business (`434cr), a yoy growth of 8.1%, while Formulation (`2,029.9cr), a yoy growth of
FII / NRIs / OCBs
10.1
5.7%. On the operating front, the EBITDA margin came in at 16.7% v/s. 21.4% (v/s. 15.7%
Indian Public / Others
5.4
expected) in 4QFY2016. The GPM’s came in at 61.6% (v/s. 65.7% in 4QFY2016), which
resulted in the dip in OPM. This, along with the 49.9% yoy increase in deprecation lead the
Adj. net profit to register `386cr (v/s. `353cr expected) v/s. `568cr in 4QFY2016, a yoy
Abs.(%)
3m 1yr 3yr
de-growth of 32.1%.
Sensex
8.4
16.5
26.7
Cadila
14.8
52.5
168.0
Outlook and valuation: We expect Cadila’s net sales to post 19.8% CAGR to `13,228cr
and EPS to report 21.0% CAGR to `21.3 over FY2017-19E. We maintain our Neutral
rating on the stock.
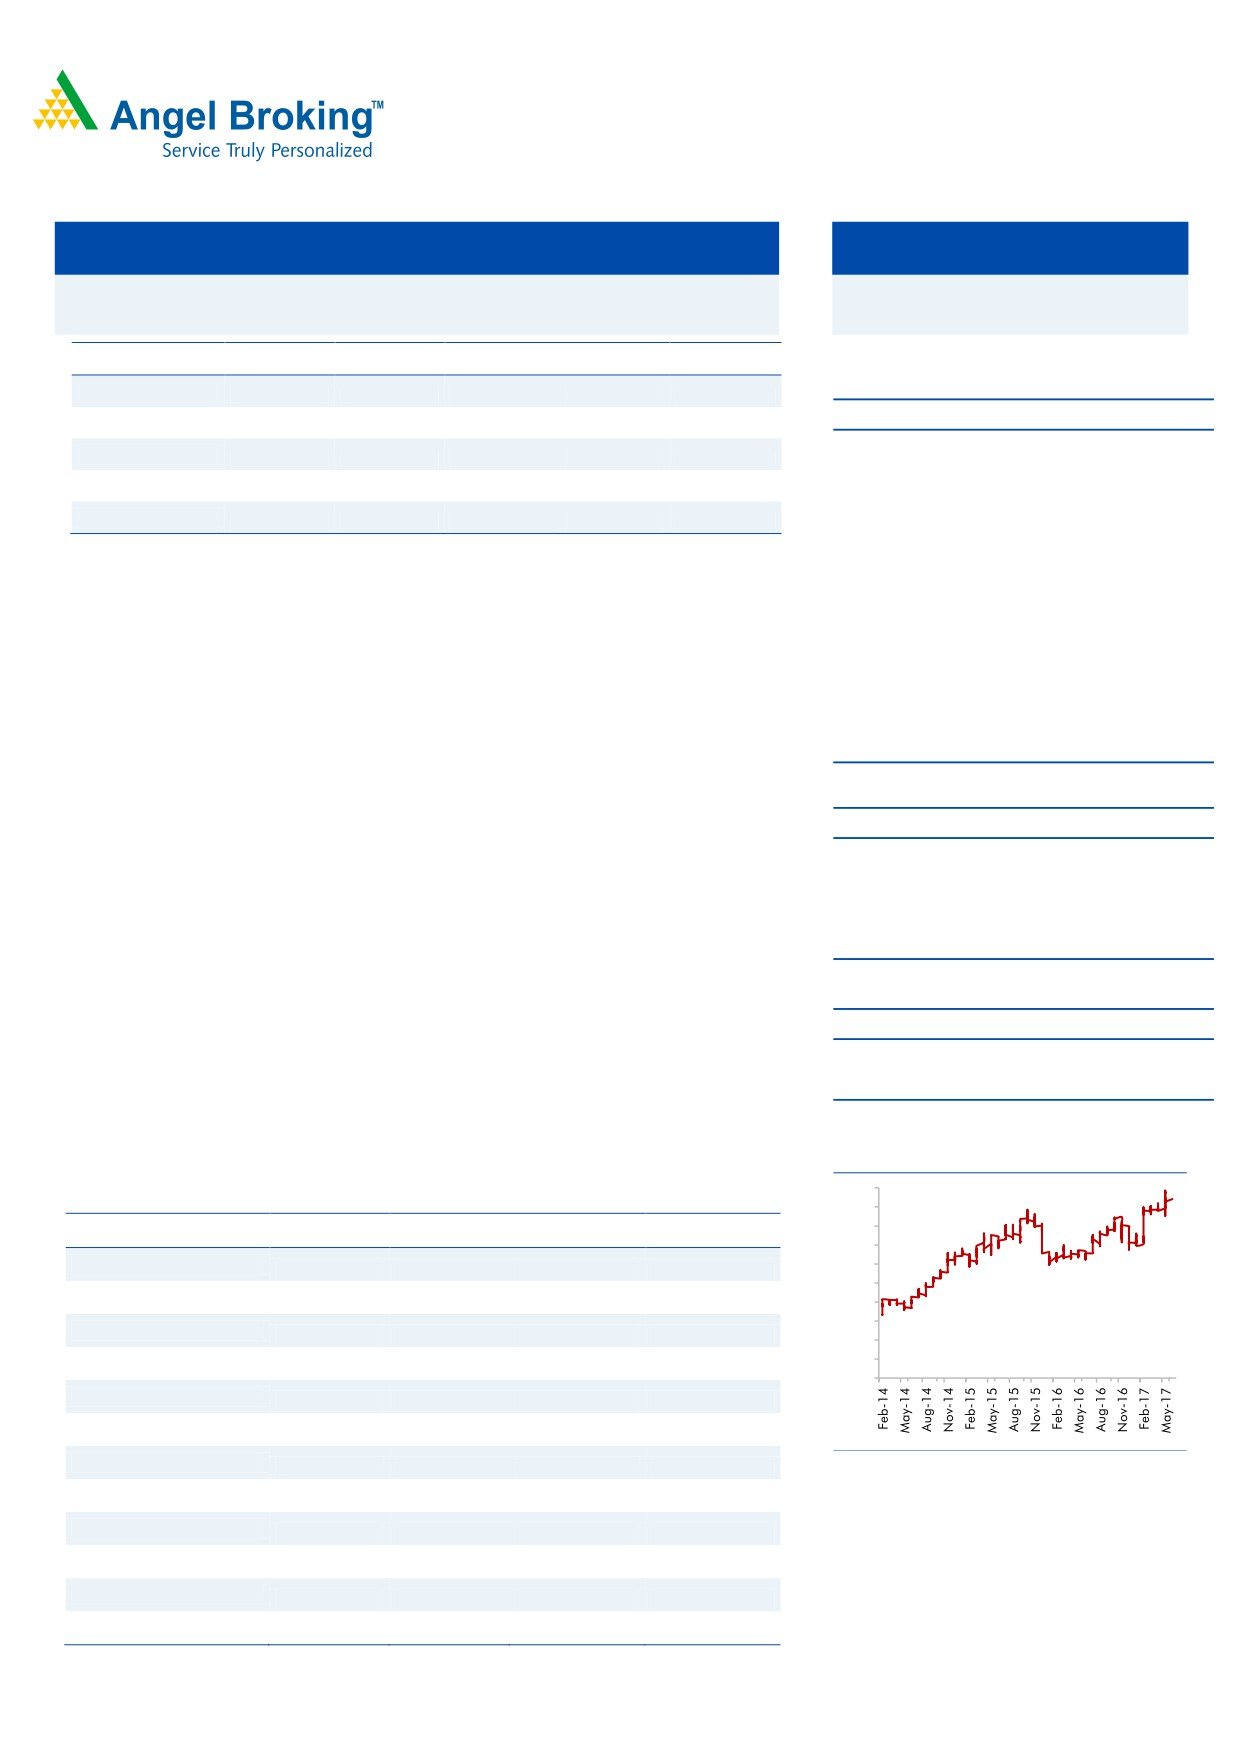
3-Year Daily Price Chart
500
Key financials (Consolidated)
450
400
Y E March (` cr)
FY2016
FY2017
FY2018E
FY2019E
350
Net sales
300
9,072
9,220
11,584
13,228
250
% chg
6.8
1.6
25.6
14.2
200
150
Net profit
1,936
1,488
1,915
2,179
100
50
% chg
67.0
(23.2)
28.7
13.8
0
EPS
18.9
14.5
18.7
21.3
EBITDA margin (%)
21.7
18.4
20.3
20.4
P/E (x)
Source: Company, Angel Research
26.2
34.0
26.4
23.2
RoE (%)
38.9
23.5
24.6
22.9
RoCE (%)
22.8
13.4
16.2
17.3
P/BV (x)
8.9
7.3
5.9
4.8
EV/Sales (x)
Sarabjit Kour Nangra
5.7
5.8
4.4
3.8
+91 22 39357600 Ext: 6806
EV/EBITDA (x)
26.0
31.4
21.6
18.4
Source: Company, Angel Research; Note: CMP as of June 2, 2017
Please refer to important disclosures at the end of this report
1
Cadila Healthcare | 4QFY2017 Result Update
Exhibit 1: 4QFY2017 performance (Consolidated)
Y/E March (` cr)
4QFY2017
3QFY2017
% chg (qoq)
4QFY2016
% chg (yoy)
FY2017
FY2016
% chg
Net Sales
2,418
2,250
7.5
2,270
6.5
9,220
9,072
1.6
Other Income
134
78
71.3
104
28.2
338
471
(28.1)
Total Income
2,551
2,328
9.6
2,375
7.4
9,558
9,542
0.2
Gross profit
1489
1350
10.3
40
3650.9
5775
5976
(3.4)
Gross margin (%)
61.6
60.0
1.7
62.6
65.9
Operating profit
403
343
17.6
486
(17.1)
1694
1973
(14.2)
Operating Margin (%)
16.7
15.2
21.4
18.4
21.7
Financial Cost
10
7
50.0
16
(37.3)
45
53
(14.8)
Depreciation
115
90
27.5
76
49.9
375
292
28.4
PBT
412
324
27.1
498
(17.2)
1612
2099
(23.2)
Tax
2
8
(76.5)
(63)
(103.0)
129
177
(27.3)
Adj. PAT before
Extra-ordinary item
410
316
29.8
561
(26.8)
1483
1921
(22.8)
Exceptional loss/(gain)
(0)
(0)
0
0
(2)
Minority
25
(8)
(427.6)
(7)
-5
-13
Reported PAT
386
324
19.0
568
(32.1)
1488
1936
(23.1)
Adj. PAT
386
324
19.0
568
(32.1)
1488
1936
(23.1)
EPS (`)
3.8
2.8
5.6
14.5
18.9
Source: Company, Angel Research
Exhibit 2: 4QFY2017 - Actual vs. Angel estimates
(` cr)
Actual
Estimates
Variance
Net Sales
2,418
2,800
(13.7)
Operating profit
403
441
(8.6)
Tax
2
69
(97.2)
Net profit
386
353
9.3
Source: Company, Angel Research
Revenue lower than our expectation
In INR terms, the consolidated revenues came in at `2,418cr (v/s. `2,800cr
expected) v/s. `2,270cr in 4QFY2016, growth of 6.5% yoy, mainly owing to the
other business which posted a yoy growth of 8.1%.
The Formulation business sales came in at `2,029.9cr, up 5.7% yoy. The sales
recorded in key markets were US (`985cr, up 2.5% yoy), Indian Formulation
(`840cr, a yoy growth of 8.9%), Emerging market Formulation (`144cr, up 8.4%
yoy) and Latin America formulation (`60.3cr, a yoy growth of 8.4%). The other
Business & Alliances (`434.2cr) grew by 8.1% yoy. Europe Formulation (`62.0cr, a
yoy dip of 12.1%), Consumer Wellness (`120cr, a yoy growth of 13.6%), Animal
Healthcare (`107.4cr, a yoy growth of 27.3%), API (`93.4cr, a yoy growth of
1.3%) and Alliances (`51.4cr, a yoy growth of 5.4%).
Cumulatively the company has received 110 ANDA approvals till date. Additionally,
Cadila filed 45 ANDAs in FY2017; cumulatively the company has filed 305 ANDA’s in
the US market.
June 5, 2017
2
Cadila Healthcare | 4QFY2017 Result Update
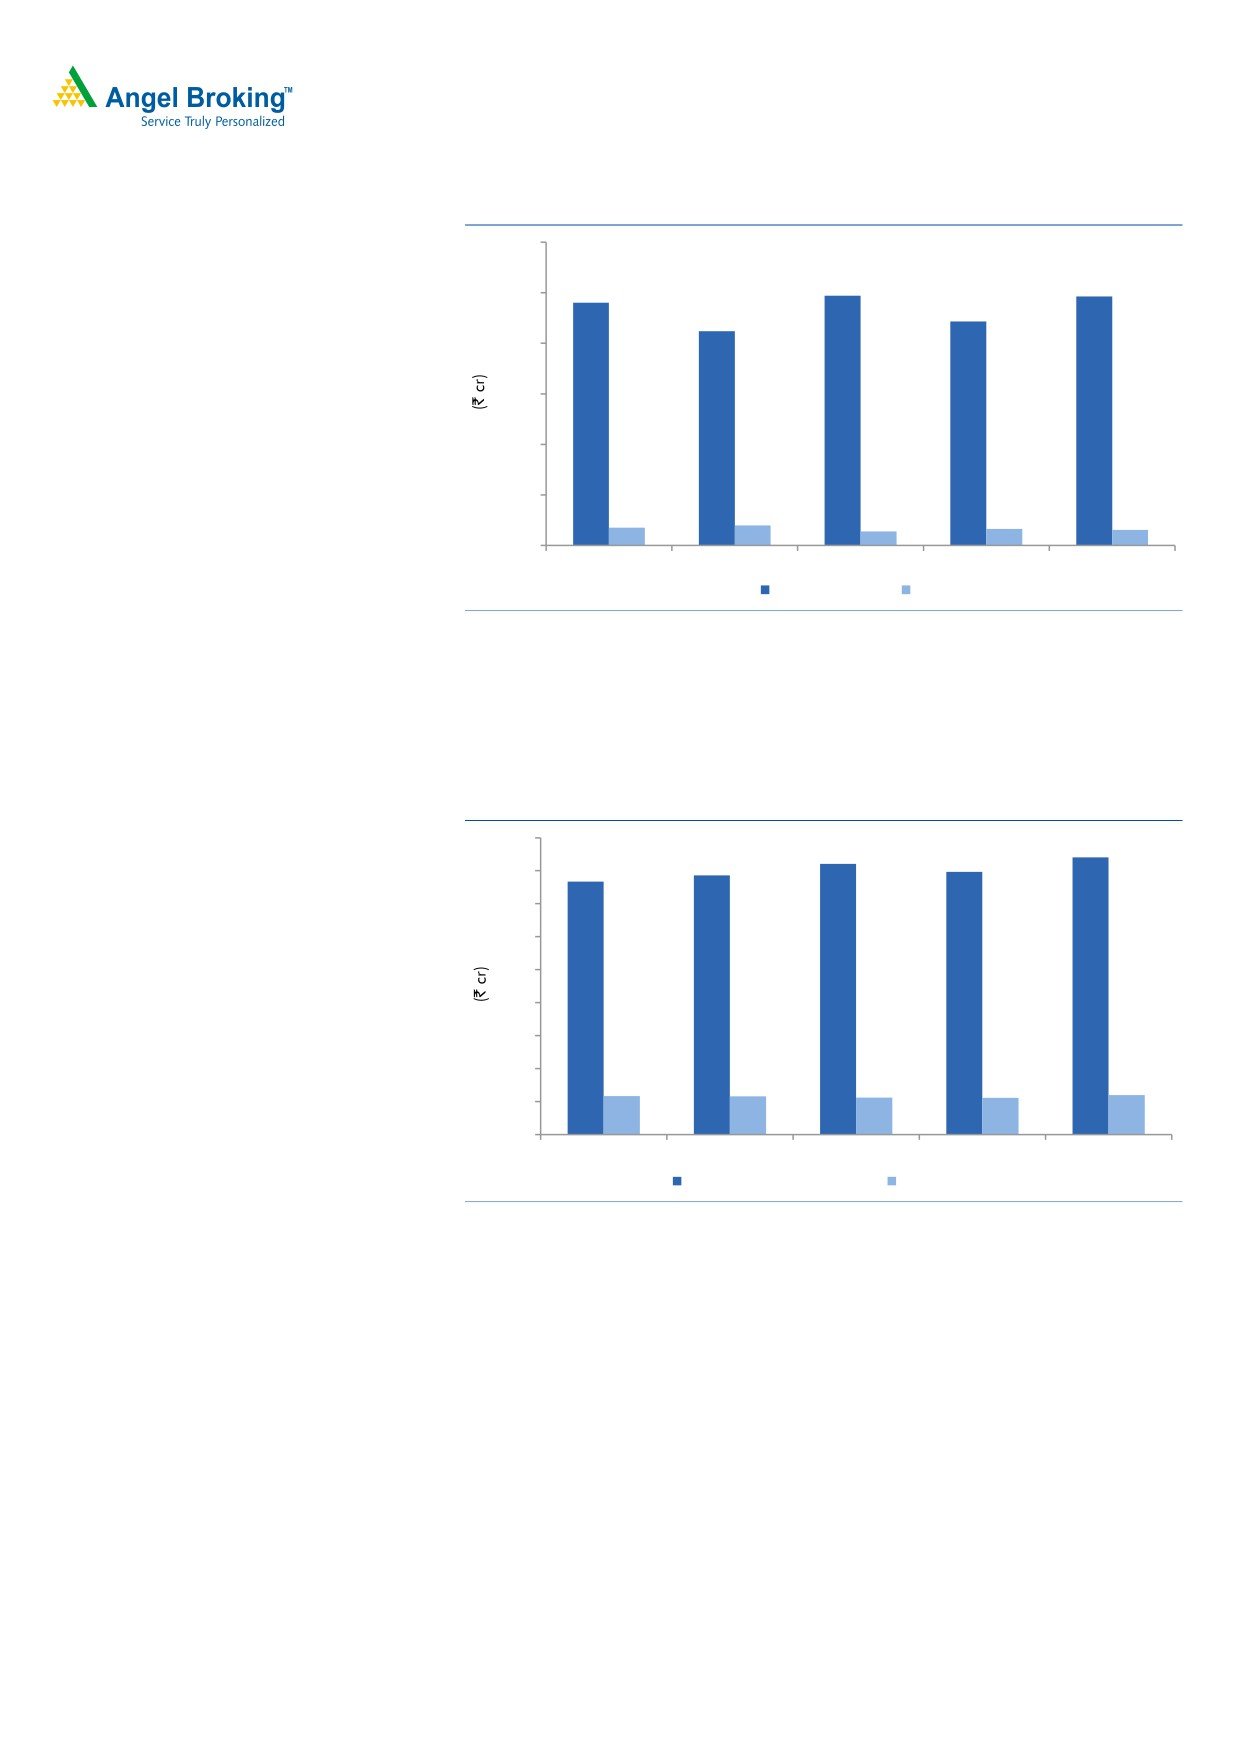
Exhibit 3: Sales trend in the US and Europe
1,200
989
985
961
1,000
887
848
800
600
400
200
70
79
56
65
62
0
4QFY2016
1QFY2017
2QFY2017
3QFY2017
4QFY2017
US
Europe
Source: Company, Angel Research
The growth in the domestic market, mainly led by Animal Health & Others
(`1,074cr), which grew by 27.3%; while formulations (`840.2cr) grew by 8.9% yoy.
API (`93.4cr), on the other hand, grew by 1.3% yoy.
Exhibit 4: Sales trend in Domestic Formulation and Consumer Wellness Divisions
900
840
821
786
797
767
800
700
600
500
400
300
200
117
116
112
111
120
100
0
4QFY2016
1QFY2017
2QFY2017
3QFY2017
4QFY2017
Domestic Formulation
Consumer division
Source: Company, Angel Research
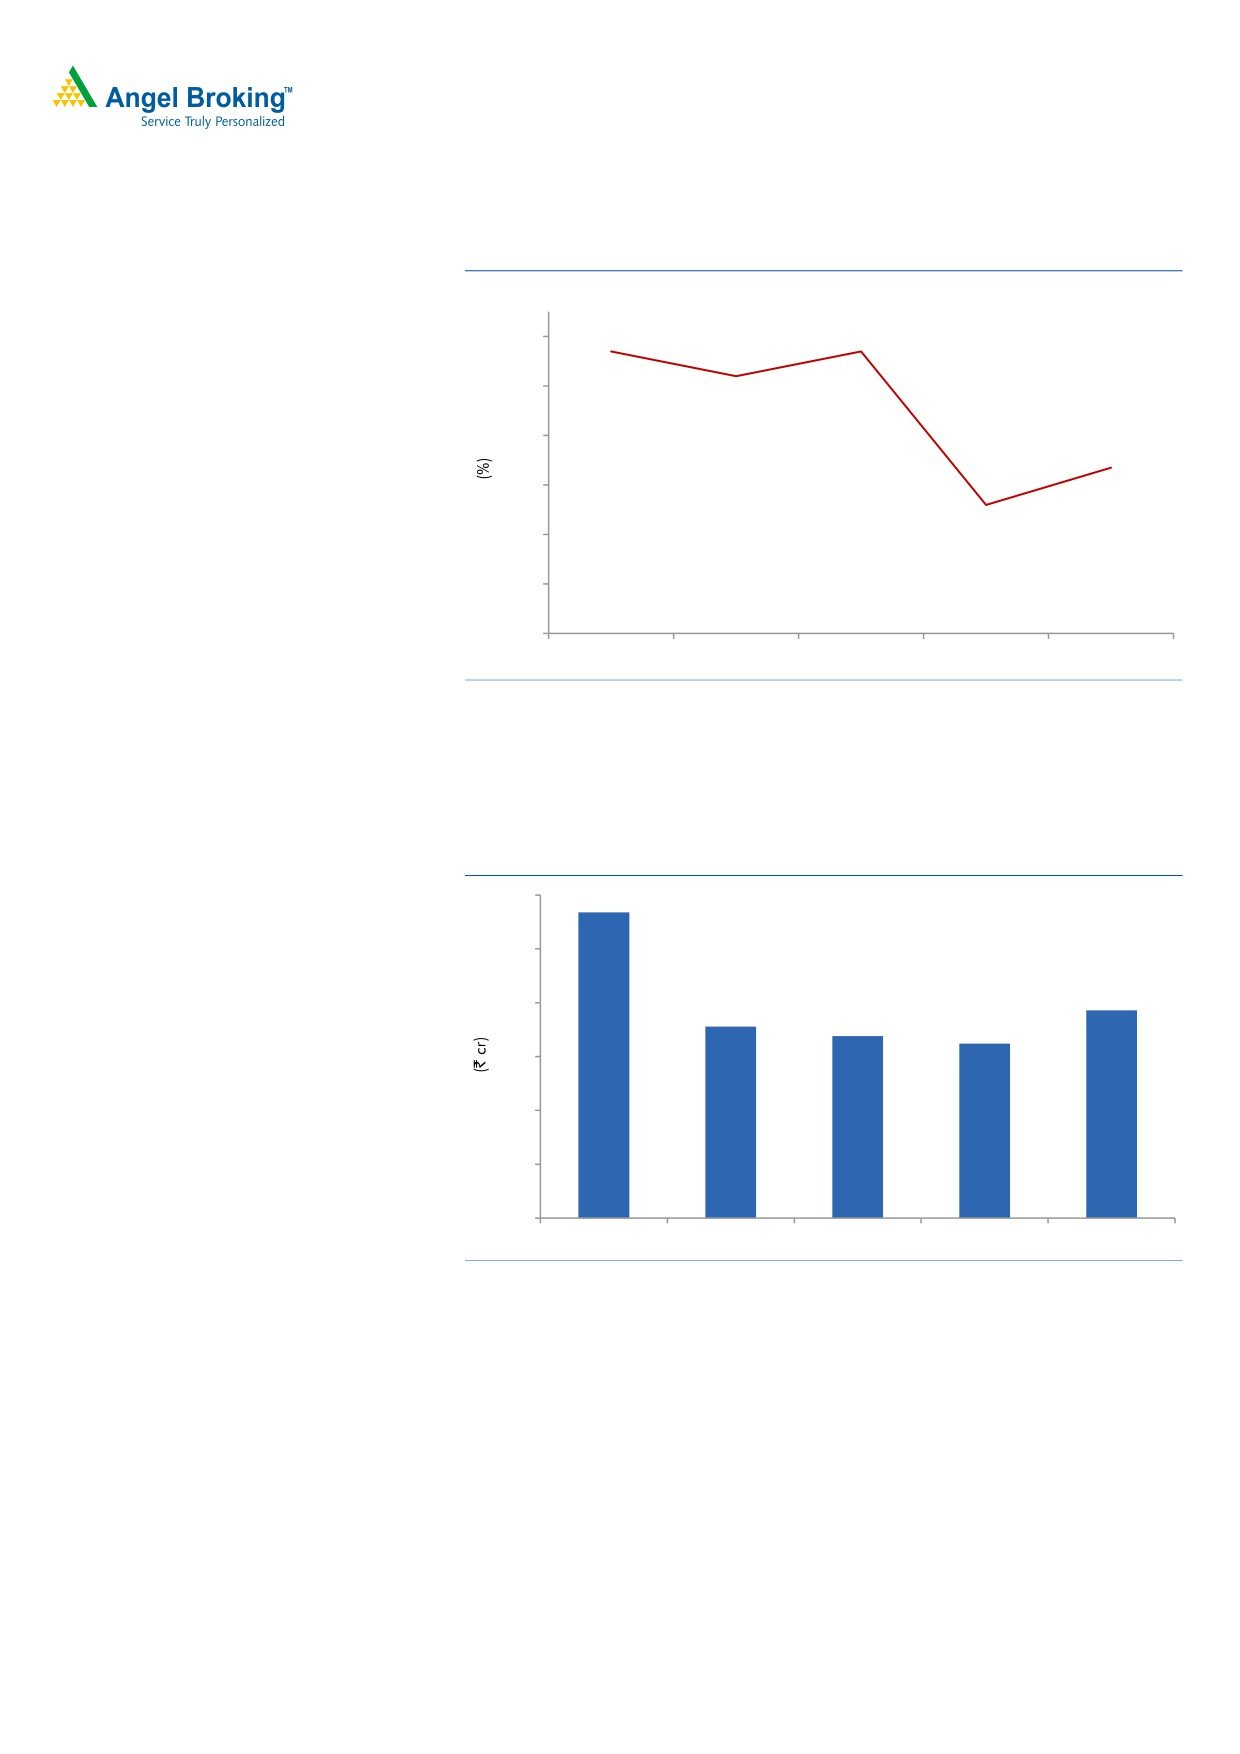
OPM lower than expectation
On the operating front, the EBITDA margin came in at 16.7% v/s. 21.4% in 4QFY2016 (v/s.
15.7% expected). The GPM’s came in at 61.6% (v/s. 65.7% in 4QFY2016), which resulted in
dip in OPM. R&D expenditure, during the quarter, came in at 9.0% (v/s. 8.0% of
sales in 4QFY2016). Employee cost during the period posted a yoy growth of
15.2%.
June 5, 2017
3
Cadila Healthcare | 4QFY2017 Result Update
Exhibit 5: OPM trend
22.0
21.4
21.4
20.0
20.4
18.0
16.0
16.7
14.0
15.2
12.0
10.0
4QFY2016
1QFY2017
2QFY2017
3QFY2017
4QFY2017
Source: Company, Angel Research
Net profit plunges 32.1% yoy: Consequently, the Adj. PAT came in at `386cr (v/s.
`353cr expected) v/s. `568cr in 4QFY2016, yoy de-growth of 32.1%. A yoy rise
in the deprecation of around 49.0%, aided the overall dip in the net profit.
Exhibit 6: Adjusted Net profit trend
600
568
500
386
400
356
338
324
300
200
100
0
4QFY2016
1QFY2017
2QFY2017
3QFY2017
4QFY2017
Source: Company, Angel Research
Concall takeaways
Moraiya warning letter closure expected in next 6 months.
Management expects R&D to remain at 7-8% of sales with increased filings in
complex products in the US.
Capex of `1,000cr expected in FY2018.
June 5, 2017
4
Cadila Healthcare | 4QFY2017 Result Update
Recommendation rationale
Strong domestic portfolio: Cadila is the fifth largest player in the domestic market
with sales of about `3,244cr in FY2017; the domestic market contributes ~39% to
its top-line. The company enjoys a leadership position in the CVS, GI, women
healthcare and respiratory segments, and has a sales force of 4,500 executives.
Further, the company has a strong consumer division through its stake in Zydus
Wellness, which has premium brands such as Sugarfree, Everyuth and Nutralite
under its umbrella. This segment, which contributes ~4.9% of sales, registered a
growth of 13.6% during FY2017.
Going forward, the company expects the segment to grow at an above-industry
rate on the back of new product launches and field force expansion. In FY2017,
sales were lower however, FY2018 should witness a rebound. During FY2017-
19E, we expect the domestic segment to grow at a CAGR of 14.3%.
Exports on a strong footing: Cadila has a two-fold focus on exports, wherein it is
targeting developed as well as emerging markets, which contributed around 61%
to its FY2016 top-line. The company has established a formidable presence in the
developed markets of US, Europe (France and Spain) and Japan. In the US, the
company achieved critical scale of `3,709cr on the sales front in FY2017. The
growth in exports to the US along with other regions like Europe would be driven
by new product launches, going forward. Overall, exports are expected to post a
CAGR of 23.7% over FY2017-19E.
Outlook and valuation
We expect Cadila’s net sales to post 19.8% CAGR to `13,228cr and EPS to report
21.0% CAGR to `21.3 over FY2017-19E. We maintain our Neutral rating on the
stock.
Exhibit 7: Key Assumptions
Key assumptions
FY2018E
FY2019E
Domestic growth (%)
15.5
13.0
Exports growth (%)
33.0
15.0
Growth in employee expenses (%)
16.8
13.5
Operating margins (excl tech. know-how fees) (%)
20.3
20.4
Capex (` cr)
1,000
1,000
Source: Company, Angel Research
June 5, 2017
5
Cadila Healthcare | 4QFY2017 Result Update
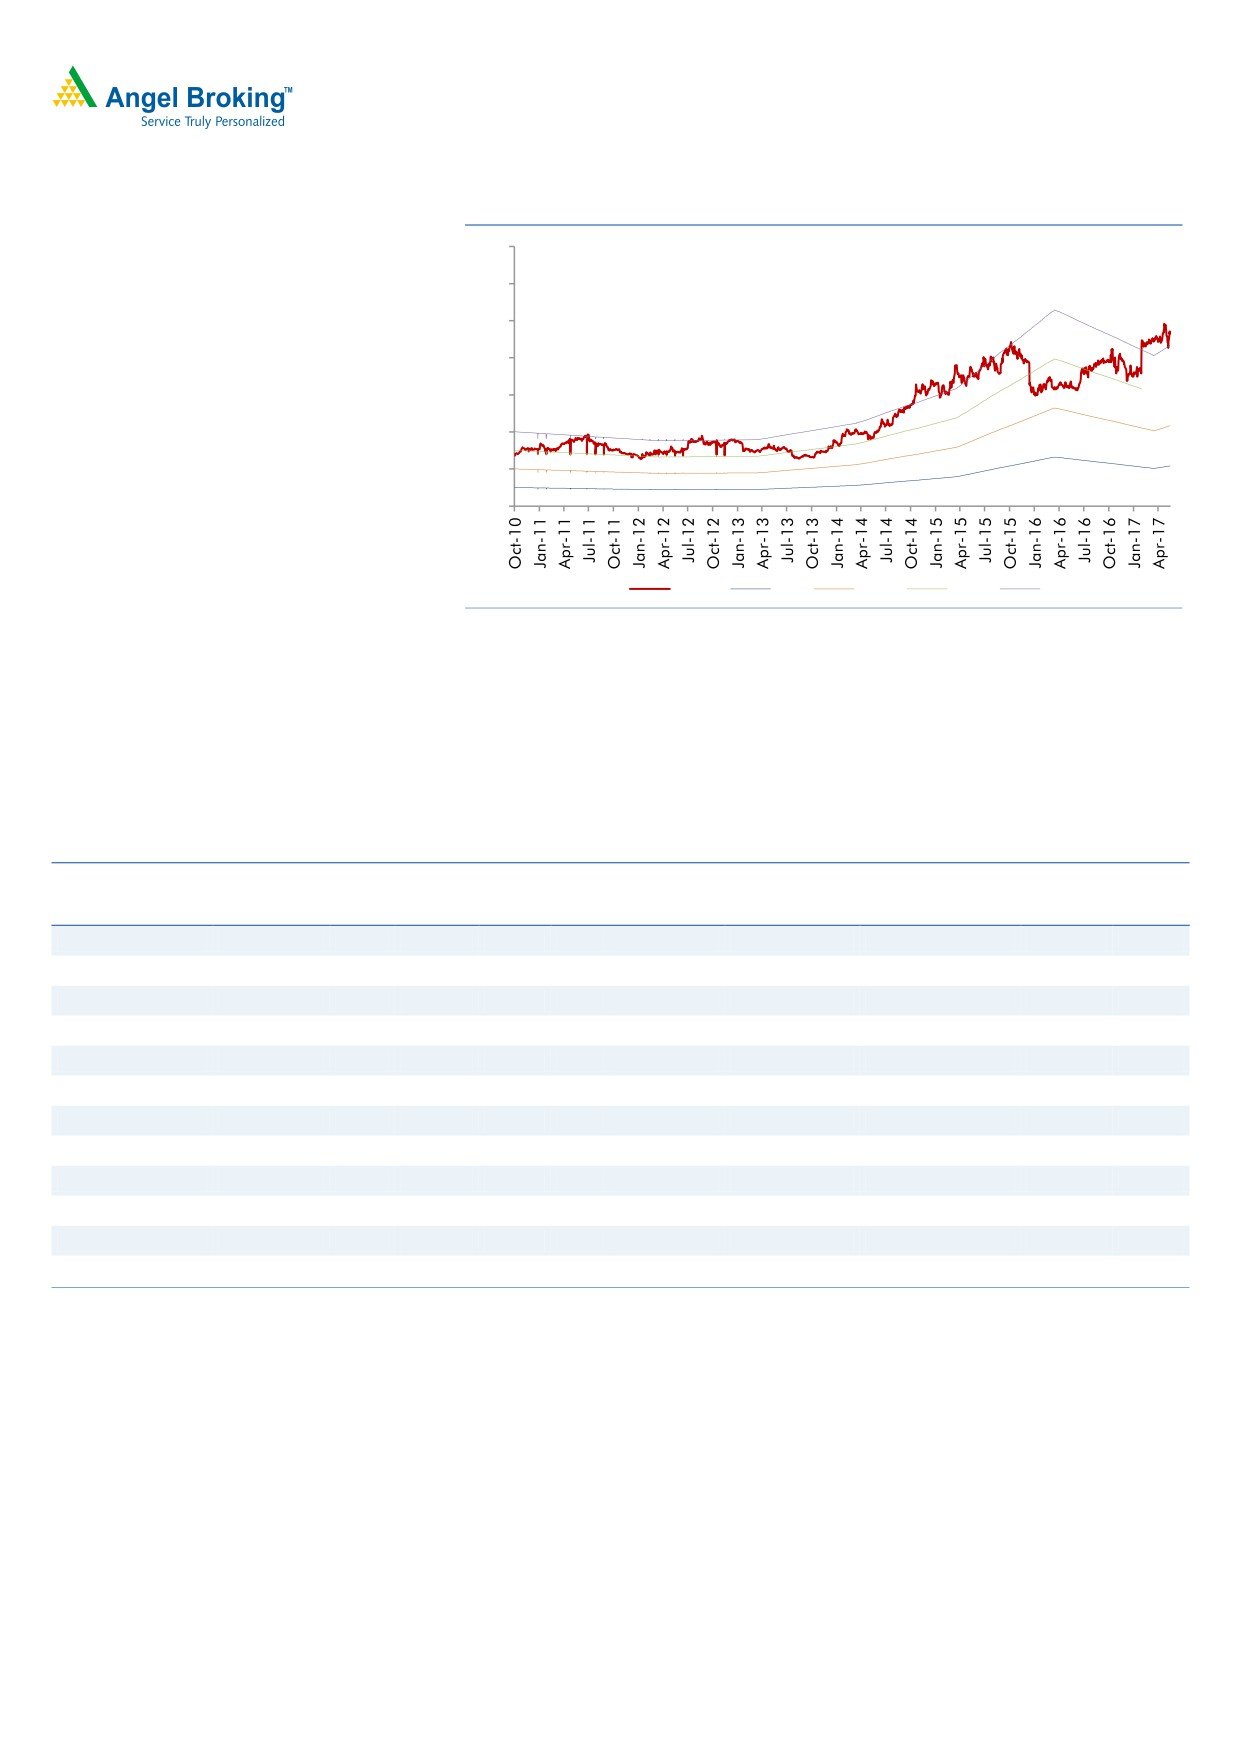
Exhibit 8: One-year forward PE band
700
600
500
400
300
200
100
0
Price
7x
14x
21x
28x
Source: Company
Company background: Cadila Healthcare‘s operations range across API,
formulations, animal health products and cosmeceuticals. The group has global
operations spread across USA, Europe, Japan, Brazil, South Africa and 25 other
emerging markets. Having already achieved the US$1bn sales mark in 2011, the
company aims to be a research-driven pharmaceutical company by 2020.
Exhibit 9: Recommendation Summary
Company
Reco
CMP
Tgt. price
Upside
FY2018E
FY16-18E
FY2018E
(`)
(`)
% PE (x) EV/Sales (x) EV/EBITDA (x)
CAGR in EPS (%) RoCE (%) RoE (%)
Alembic Pharma
Buy
537
648
20.6
21.1
2.4
11.6
(10.8)
27.5
25.3
Aurobindo Pharma
Buy
593
823
38.7
13.3
2.1
9.7
18.1
22.5
26.1
Cadila Healthcare
Neutral
495
-
-
26.4
4.4
21.6
(0.5)
16.2
24.6
Cipla
Reduce
529
465
(12.0)
21.6
2.5
14.6
14.2
12.2
13.9
Dr Reddy's
Neutral
2,553
-
-
24.1
2.9
15.4
(13.7)
10.8
13.6
Dishman Pharma
Under Review
301
-
-
26.6
2.9
12.7
16.3
13.0
13.5
GSK Pharma*
Neutral
2,460
-
-
49.6
6.2
38.4
6.0
22.3
21.3
Indoco Remedies
Buy
195
240
22.8
12.2
1.4
7.9
33.2
19.1
20.1
Ipca labs
Buy
503
613
21.8
26.2
1.8
11.8
34.8
8.6
9.5
Lupin
Buy
1,165
1,809
55.3
16.8
2.8
10.3
17.2
24.4
20.9
Sanofi India
Neutral
4,078
-
-
29.2
3.4
18.7
16.8
22.5
26.4
Sun Pharma
Buy
515
847
64.5
14.6
2.9
8.9
26.5
18.9
20.1
Source: Company, Angel Research; Note: *December year ending
June 5, 2017
6
Cadila Healthcare | 4QFY2017 Result Update
Profit & Loss statement (Consolidated)
Y/E March (` cr)
FY2014
FY2015
FY2016
FY2017
FY2018E
FY2019E
Gross sales
7,208
8,658
9,262
9,416
11,803
13,477
Less: Excise duty
148
161
190
196
218
249
Net sales
7,060
8,497
9,072
9,220
11,584
13,228
Other operating income
164
154
355
210
210
210
Total operating income
7,224
8,651
9,427
9,430
11,794
13,437
% chg
13.6
19.8
9.0
0.0
25.1
13.9
Total expenditure
6,024
6,896
7,099
7,526
9,227
10,527
Net raw materials
2,714
3,197
3,096
3,445
4,170
4,630
Other mfg costs
443
534
570
579
728
831
Personnel
1,071
1,209
1,262
1,500
1,815
2,196
Other
1,796
2,107
2,172
2,002
2,514
2,870
EBITDA
1,036
1,601
1,973
1,694
2,357
2,700
% chg
12.3
54.6
23.2
-14.2
39.2
14.6
(% of Net Sales)
14.7
18.8
21.7
18.4
20.3
20.4
Dep. & amortisation
201
287
292
375
415
485
EBIT
835
1,314
1,681
1,319
1,942
2,215
% chg
12.8
57.4
27.9
(21.5)
47.3
14.1
(% of Net Sales)
11.8
15.5
18.5
14.3
16.8
16.7
Interest & other charges
90
68
53
45
120
100
Other income
51
55
116
129
129
129
(% of PBT)
5
4
6
8
6
5
Recurring PBT
959
1,456
2,099
1,612
2,160
2,453
% chg
18.3
51.8
44.1
(23.2)
34.0
13.6
Extraordinary exp./(Inc.)
17
10
2
-
-
0
PBT (reported)
942
1,445
2,099
1,612
2,160
2,453
Tax
106.0
259.4
177.4
128.9
216.0
245.3
(% of PBT)
11.3
17.9
8.5
8.0
10.0
10.0
PAT (reported)
836
1,186
1,921
1,483
1,944
2,208
Less: Minority int. (MI)
32.6
35.5
30.0
29.1
29.1
29.1
PAT after MI (reported)
804
1,151
1,934
1,488
1,915
2,179
ADJ. PAT
819
1,159
1,936
1,488
1,915
2,179
% chg
25.0
41.5
67.0
(23.2)
28.7
13.8
(% of Net Sales)
11.4
13.5
21.3
16.1
16.5
16.5
Adj.Basic EPS (`)
8.0
11.3
18.9
14.5
18.7
21.3
Adj. Fully Diluted EPS (`)
8.0
11.3
18.9
14.5
18.7
21.3
% chg
25.0
41.5
67.0
(23.2)
28.7
13.8
June 5, 2017
7
Cadila Healthcare | 4QFY2017 Result Update
Balance Sheet (Consolidated)
Y/E March (` cr)
FY2014
FY2015
FY2016
FY2017
FY2018E
FY2019E
SOURCES OF FUNDS
Equity share capital
102
102
102
102
102
102
Reserves & Surplus
3,337
4,149
5,597
6,858
8,485
10,376
Shareholders funds
3,439
4,252
5,699
6,960
8,589
10,481
Minority interest
144
169
135
156
185
214
Total loans
2,265
2,334
2,107
4,945
3,000
2,500
Other Long Term Liabilities
55
43
61
45
46
47
Long Term Provisions
76
110
97
169
169
169
Deferred tax liability
96
59
(318)
(401)
122
123
Total liabilities
6,075
6,966
7,782
11,875
12,110
13,534
APPLICATION OF FUNDS
Gross block
3,756
4,353
4,786
5,436
6,436
7,436
Less: Acc. depreciation
1,540
1,827
2,120
2,495
2,910
3,396
Net block
2,214
2,526
2,666
3,942
3,526
4,040
Capital Work-in-Progress
892
892
892
892
892
892
Goodwill
908
733
1,141
2,465
2,465
2,465
Investments
87
154
416
435
435
435
Long Term Loans and Adv.
495
637
836
997
997
997
Current assets
3,391
4,105
4,081
5,973
7,351
8,764
Cash
549
670
639
1,544
1,870
2,553
Loans & advances
341
334
335
336
337
338
Other
2,501
3,102
3,108
4,094
5,144
5,873
Current liabilities
1,912
2,081
2,250
2,829
3,554
4,059
Net Current assets
1,480
2,024
1,831
3,144
3,796
4,706
Mis. Exp. not written off
-
-
-
-
-
-
Total assets
6,075
6,966
7,782
11,875
12,110
13,534
June 5, 2017
8
Cadila Healthcare | 4QFY2017 Result Update
Cash Flow Statement (Consolidated)
Y/E March (` cr)
FY2014
FY2015
FY2016
FY2017
FY2018E
FY2019E
Profit before tax
942
1,445
2,099
1,612
2,160
2,453
Depreciation
201
287
292
375
415
485
(Inc)/Dec in Working Cap.
168
(565)
(37)
(570)
(325)
(226)
Less: Other income
51
55
116
129
129
129
Direct taxes paid
106
259
177
129
216
245
Cash Flow from Operations
1,154
853
2,061
1,160
1,906
2,338
(Inc.)/Dec.in Fixed Assets
(296)
(597)
(433)
(650)
(1,000)
(1,000)
(Inc.)/Dec. in Investments
(65)
(68)
(262)
(19)
-
-
Other income
51
55
116
129
129
129
Cash Flow from Investing
(310)
(609)
(579)
(540)
(871)
(871)
Issue of Equity
-
-
-
-
-
-
Inc./(Dec.) in loans
(397)
91
(222)
2,894
(1,944)
(499)
Dividend Paid (Incl. Tax)
(216)
(287)
(287)
(287)
(287)
(287)
Others
(264)
74
(1,004)
(2,322)
1,524
2
Cash Flow from Financing
(877)
(122)
(1,513)
285
(708)
(784)
Inc./(Dec.) in Cash
(33)
121
(31)
905
326
683
Opening Cash balances
582
549
670
639
1,544
1,870
Closing Cash balances
549
670
639
1,544
1,870
2,553
June 5, 2017
9
Cadila Healthcare | 4QFY2017 Result Update
Key Ratios
Y/E March
FY2014
FY2015
FY2016
FY2017
FY2018E
FY2019E
Valuation Ratio (x)
P/E (on FDEPS)
61.8
43.7
26.2
34.0
26.4
23.2
P/CEPS
49.5
34.9
22.7
27.1
21.7
19.0
P/BV
14.7
11.9
8.9
7.3
5.9
4.8
Dividend yield (%)
1.5
1.5
1.5
1.5
1.5
1.5
EV/Sales
7.3
6.1
5.7
5.8
4.4
3.8
EV/EBITDA
50.1
32.3
26.0
31.4
21.6
18.4
EV / Total Assets
8.5
7.4
6.6
4.5
4.2
3.7
Per Share Data (`)
EPS (Basic)
8.0
11.3
18.9
14.5
18.7
21.3
EPS (fully diluted)
8.0
11.3
18.9
14.5
18.7
21.3
Cash EPS
10.0
14.2
21.8
18.2
22.8
26.1
DPS
7.5
7.5
7.5
7.5
7.5
7.5
Book Value
33.6
41.5
55.7
68.0
83.9
102.4
Dupont Analysis
EBIT margin
11.8
15.5
18.5
14.3
16.8
16.7
Tax retention ratio
88.7
82.1
91.5
92.0
90.0
90.0
Asset turnover (x)
1.3
1.5
1.4
1.1
1.1
1.3
ROIC (Post-tax)
13.8
18.6
23.8
14.2
17.3
19.1
Cost of Debt (Post Tax)
3.2
2.4
2.2
1.2
2.7
3.3
Leverage (x)
0.6
0.4
0.3
0.4
0.3
0.1
Operating ROE
20.1
25.8
30.8
19.1
21.8
20.1
Returns (%)
ROCE (Pre-tax)
13.8
20.2
22.8
13.4
16.2
17.3
Angel ROIC (Pre-tax)
20.6
31.3
34.4
21.8
28.0
30.5
ROE
25.3
30.1
38.9
23.5
24.6
22.9
Turnover ratios (x)
Asset Turnover (Gr. Block)
1.8
2.1
2.1
1.8
2.0
1.9
Inventory / Sales (days)
69
61
57
83
82
86
Receivables (days)
57
57
46
67
66
69
Payables (days)
55
46
49
58
59
59
WC (ex-cash) (days)
53
48
49
54
55
55
Solvency ratios (x)
Net debt to equity
0.5
0.4
0.3
0.5
0.1
(0.0)
Net debt to EBITDA
1.7
1.0
0.7
2.0
0.5
(0.0)
Int. Coverage (EBIT / Int.)
9.3
19.4
31.8
29.3
16.2
22.1
June 5, 2017
10
Cadila Healthcare | 4QFY2017 Result Update
Research Team Tel: 022 - 39357800
DISCLAIMER
Angel Broking Private Limited (hereinafter referred to as “Angel”) is a registered Member of National Stock Exchange of India Limited,
Bombay Stock Exchange Limited and Metropolitan Stock Exchange Limited. It is also registered as a Depository Participant with CDSL
and Portfolio Manager with SEBI. It also has registration with AMFI as a Mutual Fund Distributor. Angel Broking Private Limited is a
registered entity with SEBI for Research Analyst in terms of SEBI (Research Analyst) Regulations, 2014 vide registration number
INH000000164. Angel or its associates has not been debarred/ suspended by SEBI or any other regulatory authority for accessing
/dealing in securities Market. Angel or its associates/analyst has not received any compensation / managed or co-managed public
offering of securities of the company covered by Analyst during the past twelve months.
This document is solely for the personal information of the recipient, and must not be singularly used as the basis of any investment
decision. Nothing in this document should be construed as investment or financial advice. Each recipient of this document should
make such investigations as they deem necessary to arrive at an independent evaluation of an investment in the securities of the
companies referred to in this document (including the merits and risks involved), and should consult their own advisors to determine
the merits and risks of such an investment.
Reports based on technical and derivative analysis center on studying charts of a stock's price movement, outstanding positions and
trading volume, as opposed to focusing on a company's fundamentals and, as such, may not match with a report on a company's
fundamentals. Investors are advised to refer the Fundamental and Technical Research Reports available on our website to evaluate the
contrary view, if any.
The information in this document has been printed on the basis of publicly available information, internal data and other reliable
sources believed to be true, but we do not represent that it is accurate or complete and it should not be relied on as such, as this
document is for general guidance only. Angel Broking Pvt. Limited or any of its affiliates/ group companies shall not be in any way
responsible for any loss or damage that may arise to any person from any inadvertent error in the information contained in this report.
Angel Broking Pvt. Limited has not independently verified all the information contained within this document. Accordingly, we cannot
testify, nor make any representation or warranty, express or implied, to the accuracy, contents or data contained within this document.
While Angel Broking Pvt. Limited endeavors to update on a reasonable basis the information discussed in this material, there may be
regulatory, compliance, or other reasons that prevent us from doing so.
This document is being supplied to you solely for your information, and its contents, information or data may not be reproduced,
redistributed or passed on, directly or indirectly.
Neither Angel Broking Pvt. Limited, nor its directors, employees or affiliates shall be liable for any loss or damage that may arise from
or in connection with the use of this information.
Disclosure of Interest Statement
Cadila Healthcare
1. Financial interest of research analyst or Angel or his Associate or his relative
No
2. Ownership of 1% or more of the stock by research analyst or Angel or associates or relatives
No
3. Served as an officer, director or employee of the company covered under Research
No
4. Broking relationship with company covered under Research
No
Ratings (Based on expected returns
Buy (> 15%)
Accumulate (5% to 15%)
Neutral (-5 to 5%)
over 12 months investment period):
Reduce (-5% to -15%)
Sell (< -15)
June 5, 2017
11